Enjoy this Kernersville Market Report for the 4th QTR 2023. Statistics include Median Sales Price, Inventory Levels, Days on Market, and Months Supply of Inventory. If you need assistance in buying or selling a home in Kernersville, North Carolina, contact Megan Clement with Keller Williams Realty at 336-239-7501.

- Kernersville Market 4th QTR 2023
- Newest Listings in Kernersville
- Low Inventory Prices Still Rising
- Inventory of Homes & Months Supply by Property Type
- Number of New Listings & Closings
- Median Sales Price & Average Sales Price for 10 year period
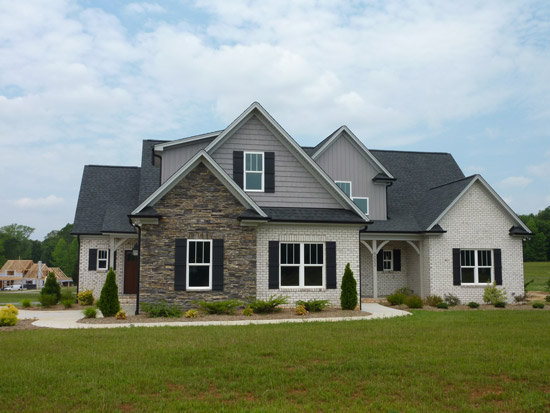
- Brunswick Crossing New Construction
- Kernersville Market 4th QTR 2023 Closed Sales
- Earlier Market Reports
- Kernersville Market 4th QTR 2023 Summary
- Map of Kernersville
- Request More Information
Kernersville Market 4th QTR 2023
 In the Kernersville Market 4th QTR 2023, the Average Sales Price for a Single-Family Home is $366,016. This is an increase of +3.2% from the 4th QTR in 2022. For Townhome Listings, the Average Sales Price is $288,045. This is a increase of +3.1% from the 4th QTR in 2022.
At the end of the 4th QTR 2023, there are 117 Single-Family homes and 54 Townhomes pending in the Kernersville, NC Real Estate Market.
Inventory at the end of December 2023, there are 121 Single-Family Homes, which is an increase of +37.5% from the 4th QTR 2022. At the end of the 4th QTR 2023, there are 20 Townhomes still available for sale. This is an increase of of +33.3% from the 4th Quarter 2022 when there were only 15 Townhomes available.
In the 4th QTR 2023, Sellers were receiving 99% of their list price for Single-Family Homes and 99.1% of their list price for Townhomes.
Newest Listings in Kernersville
Low Inventory Prices Still Rising
In the Kernersville Real Estate Market, the economic principle of Supply is the available Inventory of Homes for Sale and Demand is the Number of Active Buyers in the market.
Below are 2 interactive charts showing the Inventory of Homes and Median Sales Price for Single-Family Homes in Kernersville, North Carolina thru December 2023. You can scroll over the charts to see monthly data points.
Inventory of Homes & Months Supply by Property Type
Kernersville Market 4th QTR 2023
Inventory Levels for Existing & New
Kernersville Market 4th QTR 2023
Months Supply by Construction Type
Number of New Listings & Closings
| Primary Year | Number of New Listings | Sales, Number of |
|---|---|---|
| 2014 | 735 | 746 |
| 2015 | 825 | 807 |
| 2016 | 931 | 917 |
| 2017 | 1,098 | 1,121 |
| 2018 | 1,069 | 1,069 |
| 2019 | 1,158 | 1,139 |
| 2020 | 1,128 | 1,190 |
| 2021 | 1,246 | 1,257 |
| 2022 | 1,035 | 1,078 |
| 2023 | 977 | 884 |
Time frame is from Jan 2014 to Dec 2023
Median Sales Price & Average Sales Price for 10 year period
| Primary Year | Sale Price, Median | Sale Price, Average |
|---|---|---|
| 2014 | $154,000 | $173,901 |
| 2015 | $159,900 | $179,061 |
| 2016 | $168,700 | $186,597 |
| 2017 | $173,000 | $194,229 |
| 2018 | $187,500 | $209,429 |
| 2019 | $219,900 | $224,415 |
| 2020 | $239,450 | $249,250 |
| 2021 | $265,020 | $274,933 |
| 2022 | $315,000 | $327,792 |
| 2023 | $321,036 | $333,572
|
Time frame is from Jan 2014 to Dec 2023
Brunswick Crossing New Construction
Kernersville Market 4th QTR 2023 Closed Sales
 A total of 129 Single-Family properties closed in the Kernersville Market in the 4th QTR 2023. This is a decrease of -36.1% from the 4th QTR 2022 when there were 202 closings.
A total of 51 Townhomes closed during the 4th QTR in 2023. This is an increase of +50% from 4th QTR 2022 when there were 34 closings.
Of the Single-Family Homes closed, 68% were under contract the first 30 days on the market. The most active price point is in the $300,000 to $399,999 range, which made up 40% of the closed properties in the 4th QTR 2023.
Analysis of the absorption rate indicates an inventory of 2.1 months for Single-Family homes and 1.4 months inventory for Townhomes in the Kernersville Real Estate Market.
Earlier Market Reports
Kernersville Market 4th QTR 2023 Summary
Kernersville, NC Stats Summary
New listings increased by +17.7% for Single Family Homes in Kernersville from the previous year. Pending sales decreased by -12.7%. Closed Sales decreased by -36.1%.
The Median Sales Price for a Single-Family Home was $340,000. This was an increase of +3.3% from the 4th QTR 2022. The Average Sales Price for a Single-Family Home was $366,016 at the end of the 4th QTR 2023. This was an increase of +3.2% from the 4th QTR 2022.
Sellers are receiving 99% of their List Price. Inventory levels of Single-Family Homes increased by +37.5% from the 4th QTR 2022. At the end of the 4th QTR 2023, 121 Single-Family Homes were available. Homebuyers wanting to enter the market will continue to be challenged by the low inventory levels.
Request More Information